Wednesday, 16 November 2011
Tuesday, 15 November 2011
City Buildings
City Buildings:
This is inspired by the frame work of city buildings. they create the city forest, when there many of them gathered in close proximity.
This is inspired by the frame work of city buildings. they create the city forest, when there many of them gathered in close proximity.
3D model by chinatsu |
Thursday, 10 November 2011
Assignment 2 Final Video
This Pachube feed from the beginning, to me had some kind of notion of hybrid.
In terms of energy consumption the light should be turned off when it is not needed.
My chosen Pachube ----Creating Space with Light ----- https://pachube.com/feeds/35501
is directly releted to people. Every time Pacube censers a person coming in the room in the real world my engine creates a person in the Game. And My Analytic Engine creates an another data to measure the space and light.
As my Analytic Engine shows the number of lights turning on, the data is read from sensors which indicate that a person walked into the room.
The room is divided into 9 large areas. Each area is divided into 4 small zones, each zone has 2 sources of light. Each light has 50% of the usual light output.
So the light level increase gradually accumulates and no matter how many people are in the area there is no necessity of having a brighter light than what is needed. And the light stays on with the same bright ness until the space is emptied, in addition the light in the small zone is only turned on when someone is in the zone. This conserves energy.
Every time someone walks into a small area the small light turns on and sends a message to the larger space so the light in the larger space turns on and the light stays on until the space is emptied.
The number of people entering and leaving could be counted easily but it is not possible to control people’s movements.
Also the number of lights turned on and off in the particular area would not be so easy to be calculated in real time.
Because the area is divided into 9 the Analytic Engine is able to show in which part of the room the light was turned and off the most actively and less actively over the area of the whole room.
This Analytic Engine in Pachube is able to count the number of times the light is turned on and off by being directly connected into real time sensor and the account can be kept in the graph in Pacube feed.
FG's
This parts is mainly counting the number of time the light is switched off in the larger areas.

FG 2
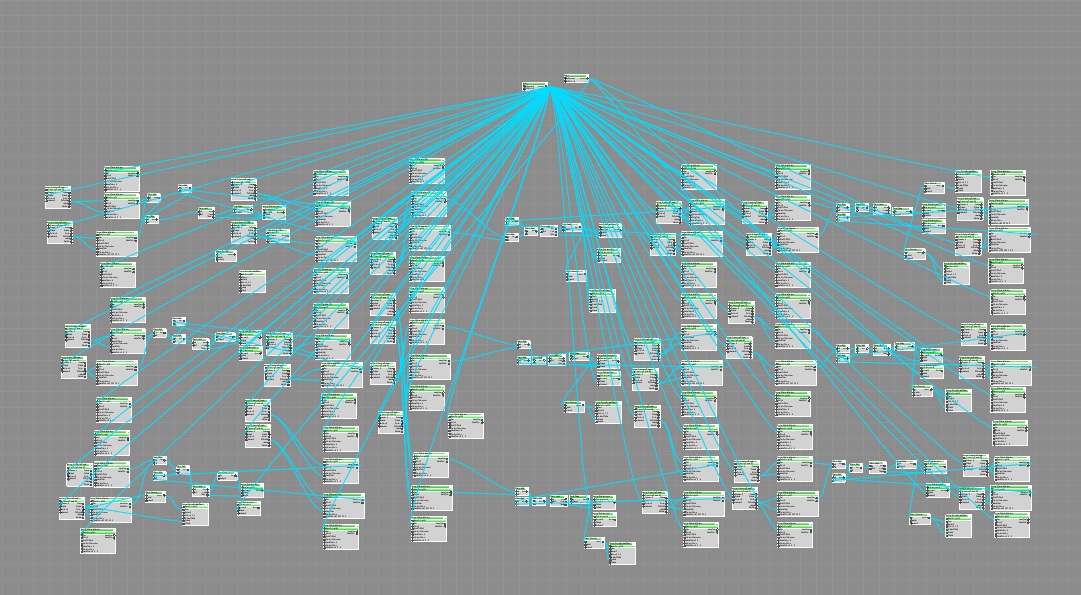
Below FG shows the way the Pachube feed is connected to the analytic Engine.
every time Pachube count a light switches on that means 1 person came into the room. we don't know who the person was so I used the Randon multiplexer.
(my chosen Pachube feed is frozen so it is reading multiple XML files every second.)


Link to
My level : http://www.gamefront.com/files/20996364/z3378274_anlysis_
Objects : http://www.gamefront.com/files/20996375/z3378274_Objects.zip
Assignment 2 : Research Assignment
Link to my Tutorial (Better resolution) but need down loading.
http://content.screencast.com/users/ChinatsuNSW/folders/Default/media/fdb982cb-3cfc-41bf-b315-b132bf3a6521/TUTORIAL3.mp4?downloadOnly=true
Link to this video on YouTube : http://youtu.be/dXvPnWoMheY
I tried to use the voice recorder but I cannot spear fast and clear enough to follow the screen so I decided to use pop ups instead.....
This tutorial is for the beginner user.
During the learning process of new software especially the users are not highly competent with the computer.
The walk-though of each step in this tutorial is made simple, and the place to find each button is clearly shown.
Without having a deep understanding of the function of each implementation the procedure is followed and the process is experimented so that viewers can easily understand the purpose of each step after tutorial was followed a couple of times.
Moving AI walk around:
This can be done with simple implementation of Flow Graph.
The most important point to make everything work correctly in Sandbox2 CrysisWar I found is not to miss any necessary steps:
• Same as the surface texture, the navigation of all of AI has to be generated for the first time only {Generate All Navigation} button needs to be assigned which can be found under AI in the tool bar.
• Under RollUpBar – AIPath - Params - Road has to be set False.
• Follow Terrain or Follow Terrain snap on the tool bar should be selected so that the path follows the surface as expected.
• The path can be re-shaped by clicking Edit Shape under Roll up Bar.
- FG can be set for AI to walk faster, follow path in reverse, to have a different stance, not go too close to each other as well.
They are many different kind of AI available in SandBox editor but When Enemy AI such as New Asian's are used unless Igor setting is used the players get attacked and enemy AI and friendly AI start fitting.
Turning the light on and off when AI enters the area:
This is a variation of the simple flow graph that was in Vhin, Ross and students from last year Margaret Gay’s tutorial in Assignment 1, but in this tutorial AI and Simple Light is used instead of the player.
We had a number of tutorials available for the gesture of the entity according to the player’s movement; I felt that there was a lack of direct information related to how to make Entity do something.
• The most important point is to tick AI only box under proximity trigger then any flow graph to make Entity change their conditions according to AI’s movement through proximity trigger, area trigger can be used.
Also in the same way of FG node mapping material parrameter can be changed as AI walk into the area.
Material can be set in default or custom made the material (colour, shader, opacity and texture) which can be changed under Material Editor.
Sources of information
In my very earlier stage of learning the process for Sandbox2 I came across tutorials of Cryazy101, Xanthochori’, DirtboxTutorials. Even though their tutorials are not architectural I found the tutorials very clear, short enough so that the specific information can be corrected easily, and quality of the videos are reliable. And being made into video tutorials I recognized many critical points that are not explained verbally, by watching where the curser goes. Creating Environment and AI related information are often found in one of those people's tutorials.
They have many tutorials available for potential architectural presentation use.
To create the architectural walk through using the proximity trigger became the critical point. There is not much information available related to Architectural use in Sandbox2 compared to software such as 3Ds Max Sketch Up. But a lot of useful information can be found in tutorials from last year students:
BENV 2423-2010 Blog Spot
http://www.benv2423-2010.blogspot.com/
Sandbox Tutorial: Lighting Effects and Flowgraph part 1/2, 2/2 by Margaret Gay
Also INCRYSIS and Moddb are a useful link for understanding of each nodes and to think through the placement of nodes.
Reading through forums sometimes answers the question.
Moddb
http://www.moddb.com/mods/petrograd/tutorials
INCRYSIS
http://www.incrysis.com/
Basic Tutorials
Dirtbox
Making AI Squadmates Follow You - YouTube
http://www.youtube.com/watch?feature=player_detailpage&v=b0lalCdCtZ0
Following AI [HD]
http://www.youtube.com/watch?feature=player_detailpage&v=J0lR66cnbso
Xanthochori
Add Rain
http://www.youtube.com/watch?feature=player_detailpage&v=PFBdL-1c2ME
Camera Scene
http://www.youtube.com/watch?feature=player_detailpage&v=QXuzcpn8kNo
Make AI Patrol 2 Points
http://www.youtube.com/watch?feature=player_detailpage&v=IGRydaZFobQ
Crysis Sandbox Tutorial 46 AI walk in Building - YouTube
http://www.youtube.com/watch?feature=player_detailpage&v=9g37kcx7J24
Cryazy101
Crysis Sandbox Tutorial 37: Vehicle Entering AI [HD]
http://www.youtube.com/watch?feature=player_detailpage&v=SA9pPKGnWpY
Make AI Drive Vehicle
http://www.youtube.com/watch?feature=player_detailpage&v=elOSbV3s0dc
Monday, 7 November 2011


Saturday, 5 November 2011
Assignment 30 second Video
3 x 30 seconds videos + some additions

Every time when 1 person gets to a place (for example to the exit) another person comes(spawns). which sends the signal to Pachube feed and Pachube feed measures the maximum value (Maybe the voltage...though it is an odd number for the voltage) and records it.
Also another sensor is placed there in the blue building and every time when someone walks into it it counts and keeps adding to the total .


This Analytic Engine is counting people entering the space and the current value through Pachube (the number shown on top) also spawning a person each time the Pachube censer catches someone coming into the room. when someone leaves the space sends the message through Pachube (the number shown at the bottom). this would be very useful if we can set up the engine to make somehow peoples movement in the room connected the real time.

This could be useful for something like a panning the placement of the entrance door and fire exit...
Thursday, 3 November 2011
Week 6 - test
Linking the Flowgraph to a Pachube feed
My main concern is whether to be able to make the link work, I am still trying to make Rose's first tutorial work but this seems to be working ok, even though this needs to be much more developed to be useful.
Monday, 31 October 2011
Week 4
Create the demonstration described in steps 1 and 2
Below video clip shows that the random movement of people in a room and the increasing glow amount by AI entering the Proximity Trigger area.
when the light amount of the object glows scene of the space appears even though the size of space is the same (or unlimited in this case) by identifying the object the field of vision can be increases and decreases. which can be used to create space with light as the concept of my chosen Pachube .
Research Assignment:
Useful link for FG:
Proximity Trigger
Friday, 28 October 2011
Proximity trigger
It is a little bit off the track of the brief, but there are kind of environment that I would like to create by using proximity trigger and area trigger visually. As my chosen Pachube describes, the number of people entering and leaving a room directly correlates to the floor area which is lit up: Especially the first video has the similar vision in theory. columns represented the cross sections of the grid which I was looking into o one of the info-graph in week 3
Thursday, 27 October 2011
week 3
My chosen info-graphs and Review of brief for my Analytics Engine
Some images are chosen from TED Talk.
Infogaphs choosen from Aaron Koblin's speech

This is a visualizing sms message sent.

This image is showing a airplane traffic:
I am imagining that a part of my experiment in Analytics Engine would be something like people walking around with a torch in their hand to start with.

Time-lapse image of the previous which is colour coded by type:
It would be ideal to separate people into types such as a age grope or the size and the weight of people.

This is a zoomed up image of images above – there is a major shipping airport.:
Possibly the analysis could be made visually not just with numbers.


"This map shows 1645 twitter accounts related to the topic of information visualization. The accounts were determined as a subjective selection of “seed accounts”, the twitter API was queried for followers and friends. In order to be included into the map, a user account needed to have at least 5 links (i.e. follow or being followed) to one of these accounts. The size of the network nodes indicates the number of followers within this network."
Each bubbles carries different information and sending it to each other. layers and layers of lines and bubbles make the whole image 3dimensional. Very slimier to the graph before I could employ the identification of the each bubbles into my project. Translucency of the bubble can be useful as well.


This info-graph can become useful information can be read from the circles but also by it having the grid informational can be read by following the grid.
A demonstration of one part of your Analytic Engine:
Below video is to demonstrate that AI following the Entity (a box) which moves around randomly,repeatedly within the specified area.
Flowgraph of the demonstration above:

The moving entity could be used to represent a kind of attraction to people and number of AI could follow the same attraction in the different speed, potentially used to create simulation of the random movement of people. But it needs to be much more developed for us to be able to use as a source of information. I spouse it is ideal to measure the density of people in a particular area especially when the number of people is unknown or the people's movement was random.
Pachube feed needs to be investigated further since I have no clear understanding of what each graphs represent. So that my Analytics Engine allow a viewer to have a clear understanding of conclusions visually.
Wednesday, 26 October 2011
Week 1
This flowgraph is to measure the speed of player followed by Vhin's tutorial.

These videos are demonstration of the flow graph above.
1st video shows the smaller number because the player is walking up the hill in comparison, the second video shows the higher number caused by the player going down the hill.
My chosen Pachube feed
Creating Space with Light
link

S.W.O.T
S -
The Idea is clearly described and unique, Yet It could easily be employed into the public space in the kind of situation that no one is present to control the light. Instead of setting the timer to turn the switch on and off, to can be automated through Pachube feed, also the amount of light can possibly be changed by the number of people. Simply when there are fewer people in the room there is no necessity to have a bright light.
W-
The feed does not show the movement of the actual measurement and it is not live, also the graph suddenly jumps up and goes down and finishes the experiment, so Information is not clear enough to indicate the real result.
O-
It is very hard to physically simulate people’s movement. Perhaps analytic engine can bring a good economical simulation with the invention and combination of the flow graphs. Number of different situation and different kind of attraction for people could be created to calculate the people’ movement and typical behavior.
Also this could be used to measure the size of the room needed during the design process.
The amount of light could represent the temperature as well.
The amount of light could represent the temperature as well.
T-
I feel apprehensive about using this feed but I guess I need to investigate what this person has done. Also because of the lack of the clarity of this feed the idea of the Pachube can be miss read.
Tuesday, 25 October 2011
Week 2
Brief for my Analytic Engine
This is just an idea …
100 people in the audience of a participation theatrical performance.
Each person has a single candle (or the same amount of light source) switch will reflect onto the floor. Candle is the basic unit of measurement of light. It also produce some light and CO2.
The audience is gathered in a large room with two doorways in one wall.
They are instructed to go through to the next room with their candles to get a drink.
The drink is in a smaller room.
As each person leaves the large room and enters the small room they take a small unit or light with them(a candle) one person does not have enough to find the drink table. As more people enter with their candles light level increases and the table become visible.
Then more light and the bottles and glasses can be seen.
People naturally gather around the table and as the room becomes crowded they move out and back to the lager room.
Some people stay longer to drink more. Some don’t even drink so was attracted to something else. Some come again from the large room for another drink.
Each candle is 250 mm long and burns for 25mins. The candles are segmented in 5 parts. Each part burns with a different color such as 0-4mins-blue 5-9mins red etc.
Somehow, I would like to find the way to keep the path way of people and make it into a kind of a graph so that we can record the people’s behavior not just creating the a space with light. So that we can find out that which part of room is used mostly very 5 mines during the 25 mines lifetime of candles.
Implementation of the flow graph.


The test run in the game.
This is the average speed been calculated during the test run.

Sunday, 11 September 2011
Experiment 1 Final Video - Pure War
video
This is the presentation of the actions of military industrial machinations.The world map shows concentration of military activity hot spots glowing with intensity in the real time.
Description of the modes
Blowing lights on the computer:
When the local player goes closer to the entity it changes the magnitudes and reciprocal and multiply the glow of the material by 20.
Street lights:
When it turns to the cetin time of the day Indirect light gets abled and disabled. There is a time delay placed to uneven the timing.
Map of the world and light effects:
When the local player enters the proximity trigger area Alien Weapons, 4 rings get turned on and start moving to the specified position which defined by the position of each other.
Also the area triggers enable a light to turn on.
Cog wheels:
Similar method to the one above. Movement:RotateEntity enable to turning the wheel s in the specified wise.
AI driving the car:
When the game starts AIs go to the specified seats when it succeed AI follow the path in the car a node is placed for the AIs to ignore local players and Idles.
AI follow path when the game starts.
Gravity Volume reacts when the game starts Time Delay disable gravity volume after 5 seconds.
Google Sketchup Warehouse
BENV2423 Experiment1 Model:
Links to my Levels and Objects in Game front
Level :
http://www.gamefront.com/files/20793631/Quarry.factory7.cry
Objects :
http://www.gamefront.com/files/20793636/chassis.dds
http://www.gamefront.com/files/20793637/pure+war+.cgf
http://www.gamefront.com/files/20793640/Objects.zip
Subscribe to:
Comments (Atom)